Saturday, October 25, 2014

Radio Waves in Magnetic Resonance Imaging (MRI)

Radio waves in MRI

Author : Ms. Kalpana Parajuli
MSc Medical Imaging Graduate

It is true that we, who are associated with field of medical imaging, are mainly concerned with detrimental effects of ionizing electromagnetic radiation. It seems that our attention is biased and it is high time we realized we are surrounded by non-ionizing radiation and we should know how they interact with biological tissue. This article will mainly focus on radio waves, electromagnetic waves of frequency ranging from 9 kHz and 300 GHz that are used to perturb the longitudinal magnetization in order to produce MR signal. Those of us who belong to this dynamic and ever progressing field of medical imaging should know that the way by which radio wave interacts with the matter is quite different from the pathway that ionizing radiation such as x radiation takes. It is because these waves lack enough energy needed for compton or photoelectric interaction. For the ionization or the breakage of covalent bond to occur a single photon should interact with the electrons in the atomic orbital which is not possible with RF waves that releases its energy through the interaction of multiple photons. The effects of RF energy in human body can be divided into two categories.


a) Thermal also called dielectric heading:


 Heating effect of RF waves is best explained by the phenomenon polar molecules show under an electri field. Radio waves are nothing but the oscillating electric and magnetic fields. Under the sinusoidally changing electric field, the polar molecules, molecule with non-zero dipole moment,  begin to rotate, as a result of which collision between molecules occurs followed by energy transfer from these molecules to the adjacent molecules. The resultant agitation and energy transfer cause increase in temperature and production of heat respectively. Similarly changing magnetic field induces the electric field (Faradays law) in human body that deposits the energy in the form of heat as described above.


The behavior of electric and magnetic field of radio waves depends on the distance between the source of radiation and the object on which it is incident, as well as on its frequency. The patient in MRI is exposed to waves of frequency that  range from  8.5 to 340 MHz and the scanner is in the “near field” i.e “d” is less than one wavelength so heat production is mostly by the magnetic field of RF waves with little or minimal effect of electric field of RF wave. The reason behind this sort of dominance is the independent relationship between “E” and “B” in the near field.

 b) Non-Thermal :


These are specific effects that occur due to interaction of magnetic and electric field vector with human body other than heating. Very less is known about non-thermal effects because of lack of conclusive scientific evidence in human models and therefore not taken into account by regulatory bodies while providing guidelines on safety limit.
Specific Absorption Rate (SAR) is the name of dosimetric quantity used to describe the rate of heat deposition in unit mass of tissue, and is measured in W/kg.

What affects SAR in MR imaging?
The answer to this question is given by the figure below.


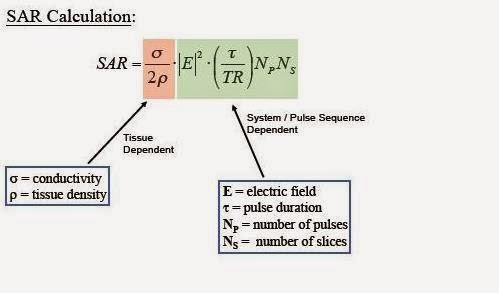
It is thus clear from above formula that SAR is the function of patient related factors as well as scan parameters. SAR increases with the square of magnetic field strength of the magnet system of scanner, because high power radio waves are needed to cause resonating effect on the spins of higher larmor frequency. It also increases with the square of the flip angle, whereas it varies proportionally with the duty cycle (ratio of average to peak RF power) and patient weight. Because conductivity and tissue density vary from person to person, the calculation of SAR is not easy and accurate. Animal experiments have shown that the permittivity and conductivity of tissue decreases with age thus young ones are more vulnerable to deleterious effects of radio waves. It also depends on the perfusion status and geometric configuration of exposed tissue and presence of metallic implants. Dependency of SAR on several factors is one reason behind the challenges in RF dosimetry.


SAR of 1W/kg is said to cause increase in temperature of insulated object (phantom) by 1⁰C in an hour. In human and animals, input of 4W/kg of SAR has shown to raise the temperature by 1⁰C. It is not practical to measure change in temperature (core/whole body or localized) thus SAR is used to quantify the RF exposure. International Electrotechnical Commission( IEC 60601-2-33) and Food And Drug Administration (FDA) has given limits for both temperature as well as values of SAR (shown below). The guidelines consist of limits for the whole body and local level exposure, because some organs are highly heat sensitive than others because of higher resistance, and are less affected by thermoregulatory system of body because of less perfusion, for example:  eye, gonads, and thus separate limit for local RF exposure was required.


It is now realized that separate guideline is necessary to account the change (increase) in SAR by metal implanted in the body of patients. However none of the current guidelines have addressed this issue. The limits are also given for occupational exposure. Those given by (IEC) are same as that for patients whereas that by Institute of Electrical and Electronics Engineers (IEEE) and International Commission on Non-Ionizing Radiation (ICNIRP) are one tenth of the maximum limit for patients.


Just like CTDI volume and Dose Length Product are displayed in the CT scanner, SAR value is also displayed on the monitor of the MRI system. There are many methods available for estimation of SAR. Two basic methods are caloriemetric method and pulse energy method. At the beginning of the scanning the machine runs calibration to find out the energy required to flip the spins by 90 and 180 degree. Power is then obtained by dividing the total energy of all pulse in one sequence with time of repetition (TR), and the result is ultimately divided by weight of the patient to get SAR. This is why the scanner requires us to input the value of weight of the patient.


Till now we believe that increase in patient weight increases the SAR and all of us have habit of looking at the value of SAR given by the machine itself to determine whether our protocols are safe. However results of a recent study were quite astounding because negative correlation was observed between patient weight and the SAR calculated by 3T scanner, whereas in 1.5 T scanners the relationship was maintained. This study has indeed raised a big question mark on the reliability of the values of SAR provided by the manufacturers of MRI scanner.


What about the consequences of RF induced heating in human?
Many incidents of second and higher degree burn in patients undergoing examination in 1.5 and 3.0T MR systems have been reported. While documentation of adverse consequence of RF associated heating of the metallic implants are available, other physiologic response for example- changes in heart rate, oxygen saturation, blood pressure, respiratory rate and cutaneous blood flow has not shown to cause effects that needs serious concern.


What are the possible ways to reduce SAR in MRI?
We are familiar with the tradeoffs between the radiation dose in CT and the image quality. A balance between them is essential part of protocol selection. Similarly in MRI as well, SAR can be minimized through wise selection of parameters, which however also affects other areas like imaging time, image quality etc. For example: reducing the flip angle affects the image contrast, reducing the no of slices increases imaging time. Other methods can be; reducing the echo train length of turbo spin echo or fast spin echoes, the use of quadrature rather than linear coils for
transmission. Parallel imaging technique, by using multiple receivers increases the amount of data received and thus reduces the imaging time by a certain factor (reduction factor) without the use of additional RF pulse and thus reduces SAR.


In conclusion safety issues regarding use of radio waves in MRI are gaining much more attention than ever mainly because of three reasons - 3T scanners, that needs high power RF amplifiers, about 35 kW, are widely being used; the popularity of new RF intensive sequences (HASTE, FIESTA, true FISP) have also heightened and MRI is no longer contraindicated for the patients with implanted materials. Thus it is necessary that manufacturer, the scientific research community and user should collaborate with each other to prevent the potential hazardous situation that can arise due to RF energy in MR environment.


MSc Medical Imaging Graduate Ms. Kalpana Parajuli
Maharajgunj Medical Campus (MMC),
Tribhuvan University Teaching Hospital (TUTH),
Kathmandu, Nepal


Friday, October 10, 2014

What is radiation quality?

What is radiation quality? 

A measure of the damage potential of a particular radiation type,this means alpha betas and gammas and positrons for example,has different abilities to cause damage to tissue,this damage potential is related to its size, charge and energy,we have a good example of this with amunitions, let's take a unit that you already know well,

energy gained by electron being accelerated through a field of 1 V,now to begin the radiation damage to tissue, let's first see the linear energy transfer,it is a measure of energy absorbed by the material, keV/length...somewhat related to the track or path.let's consider a beta particle moving through a particle such as lead brick,it should be intuitive and it interacts, it transfers it's energy to the material.high LET=more energy transfer and shorter distance travelled.Because it loses energy quickly.ability to produce more damage,of course we are concerned with biological damage,before we begin to understand the damage of radiation, we must discuss radiation dose measurements in radiation symmetry.

radioactivity rate of decay= number of disintegration per unit time (usually sec)
exposure=the electric charge in air due to the presence of radiation, the total sum of kinetic energy of charged particles liberated by uncharged radiation.

absorbed dose=similar to exposure-consider tissue type
energy deposited in tissue.value of absorbed dose from same radiation will change with tissue type.

1Roentgen = 1Rad
100rad=1Gy
in human tissue, about 87% of 1R is absorbed 0.87R=1rad
dose equivalent=corrects absorbed dose for damage potential of radiation type
must provide a weight factor of radiation types.
QF or RBE,gives numerical value to the damage potential.
QF=dose from standard radiation to produce given biological effect/dose from test radiation to produce same biological effect
standard radiation -200 kVp x-rays
dose equivalent:
rem \ sievert
100 rem=1Sv,
Dose equivalent =absorbed dose x QF or RBE
ICRP defined values for QF/RBE
gamma x rays 1
electrons (beta/positron) 1
neutrons 10
alpha 20
QF INCREASES as LET increases
150mrad x 1 gamma - 150 rem
75 mrad x 20 alpha = 1500 rem
total dose equivalent = 150 + 1500 rem
for QF =1
general rule 1 R =1 rad = 1 rem
reality:
1 rad = 0.96 rem or 0.87 R = 1 rad
there is no universally accepted conversion from rad to rem.
exposure: air
absorbed dose: considers material
dose equivalent: considers radiation type
effective dose equivalent:
measures the biological risk on the whole body by considering different tissue types response differently to radiation ; also accounts for radiation to only part of the body vs the whole body.

to account for different tissue response, weight factors are used (yes, again), weight factors determined by ICRP.
2007 revision of ICRP recommendations:
14 designated tissues for organs + 1 for everything else.
to calculate: summation of- Dose Equivalent x Weight Factor
For all designated tissues/organs irradiated
H = summation Wt x Ht
How do we account for long term dose to an organ? inhaled, injected or swallowed
committed dose equivalent: Ht,50, the dose equivalent to an organ or tissue received during the 50 year period following intake of the radioactive material, we use 50 because there isnot so much damage after 50,as the receipent would likely to be perished by then.committed dose equivalent accounts for physical decay and body excretion.

biological half life: SAME principle as radioactive or physical half life,and it is how we account for body excretion of radioactive material,it is important to know that it is an approximation differs from person to person,sickness are different and medications are different,

Biological Half life:depends on the renal system and the bowels, the overall disappearance of radioactivity from the body depends on effective half life, consider both physical and biological decays,
1/effective halflife=1/biological halflife + 1/physical halflife
we have seen many ways to calculate dose now considering many variables.
it becomes very complex trying to calculate a specific dose to a specific organ.
source organ is lung, target organ is liver.after.....then same organ liver can be source and target.
to calculate dose to the liver precisely we need to answer few questions//
exact location in lungs, time spent in lungs, exact location lin liver, time spent in liver.
doses from each adjacent organ of liver must be considered, which becomes even more complicated.
another factor we must consider in calculating dose to tissue is the percentage of radioactive emissions that deposit energy in the tissue vs those that escape.this value is called the absorbed fraction.
depends on track, density and thickness, radiation type, energy and half life.
absorbed fraction will be expressed as a number b/w 0-1, where 1.0 equals 100% absorption.
with all of these factors, how can we ever calculate an accurate dose to an organ?
MIRD - Medical Internal Radiation Dose Committee:which is the permanent committe of nuclear medicine provided a widely accepted method to calculate internal dose,
the first method is to calculate cumulated activity;plot activity vs time, area under the curve is the cumulated activity;units = activity x time uCi x hr
it is important to understand that the cumulated activity is the first step in determining the dose to an organ that a patient receives from a nuclear medicine procedure.
S factor: consider most of the physical aspects of location of radioactive material,
total energy associated with the radiation typexabsorbed fraction in target of source/mass of the target organ.
complications of calculating S factor: absorbed fraction varies greatly with gamma rays, also all transitions, disintegrations and emissions must be included not just the primary decay, for 99mTc, there are altogether 14 radiations to include.this include conversion electrons, fluorescent x-rays and auger electrons,

lucky for us, MIRD published all the values of S-factor, so we don't need to calculate all these values.
DOSE equation of MiRD=cumulated activity x S-factor
Cumulated Activity = Biological Parameters
S-factor = Physical parameters
 review:
LET and its affect on dose
all measurements of radioactive energy deposit
unit conversion b/w SI and traditional
how to incorporate QF in dodse calculations
how to calculate effective half life
how to calculate organ dose using MIRD scheme

Reference:

Sunday, October 5, 2014

Geiger Muller - Gas Filled Detector

Geiger Muller - Gas Filled Detector

Geiger Muller or counters are one of the kind of gas filled detector;that operate by using the ionising nature of alpha, beta and gamma radiation;neutron sensitive devices can also be produced;typically by introducing boron;which interacts with neutrons to produce secondary ionization particles that trigger the counter response. The GM tube is a shield metal tube cylinder with low pressure inert gas such as Argon or Neon;a thin metal wire runs down the center of the tube; which is electrically insulated from outer cylinder till the end of the tube; the front of the tube is shield with radiation window,that is specific to typical radiation that is to be detected by the counter;a thin micro window is to be used if the tube is to be sensitive to alpha particles and low energy beta particles;both of which have low penetrating power;a thicker window of different material such as glass or thin sheet of metal is to be used to measure high energy beta particles while for gamma rays.

The tube is often shield without a window;in such tubes, the detection occurs when high energy photons liberate electrons from the tube outerwall,the inner wire and outer wall are maintained at a pd of about 1kV and in the absence of radiation, no current can flow through inert gas b/w the central anode and the outer cathode; the connections are made by wires into a connection housing;fixed over the rare of the tube;and the outer tube guard is actually screwed onto the tube to protect the actual GM tube;this tube guard can be open at the end or can be covered with an energy filter;to change the energy and particle sensitivity of the device or a careful calibration is used, it allows for ambient dose measurement;rather than ambient count measurement to be made;the wires are connected to the tube to the control electronics;by power to perform counting operations and allow functions such as conversion from counts to dose, data logging, data averaging and driving the display;the tube works on the basis of gas amplification,incoming radiation ionizes some of the inert detector gas resulting in a free electron and a positively charged ion; the electric field inside the tube attract the charged ions towards outer cathode while the electrons are attracted towards central anode, as the electrons encounter the anode, the electrons experience the growing strength so that their accelerating forces increases, near the anode the acceleration is such that enough energy that it either excites the electrons in other atoms of the detector gas,or ionize them completely, excited electrons quickly decay releasing photons that can trigger ionization farther along the tube while the electrons free due to ionization can go on to cause further ionization leading to an exponential growth; this is often referred to as avalanche effect.

The charge migration in the tube leads to reduction of potential in an anode and increase in potential of the cathode either of which may be detected as a signal by the counter electronics,as the negative charge around the anode increases, the effective electric field is reduced, eventually this reduction is such that further avalanche are not possible, and the tube can no longer detect radiation,this step persist until the sufficient electrons have recombined with the anode, and the positive gas ions recombine with the cathode so that the field is recoverable enough in strength to trigger another avalanche,this is so k/a dead time of the detector,the time after detection the counter is insensitive to further events and this existence means that the detector count rates must be corrected to give the actual count rate,after the dead time further detection are possible with reduced signal strength, the total time that elapses before the full strength signal is produced by subsequent events is k/a recovery time.

Part 2:
The recombination of positive gas ions at cathode may be problematic as the ions may be neutralized in excited state or dislodge electrons at the cathode,when in excited state the atoms will eventually decay to ground state by emitting a photon and these photons and the dislodged electrons may be the cause of reionisation of the gas triggering another avalanche so the single detection event will lead to a continuous discharge, to prevent this a quenching mechanism is used, the quenching may be electronic so the electric field is removed fro a short period of time following an event to prevent further discharge or may be inherent in the design by mixing quenching gases with the detection gases such quenching gases are easier to ionize than detection gas so that during migration to the cathode, the detection gas is neutralized by the quenching gas which then becomes the positive ion, migrating to the cathode, when the charged quenching gas ions recombines with the cathode, it does so in the ground state so that further avalanche discharge is avoided.

The most effective quenching gas are the organic compounds,but these are dissociated irreversibly during quenching which gives the tube operating limiting longevity, an alternative is to use halogen gas which is recovered full at cathode, so avoid the removal of quenching gas, the raw output from GM tube shows a fraction of radiation counts per sec which is modified by taking in account of the dead time to give actual counts per sec; if the radiation type and energy are known, then the counts per sec can be calibrated so that the unique gives an equivalent dose rate,this is not the best method for dose determination from an unknown source as in the GM tube signal pool side is relatively insensitive to the instant radiation energy type, so the energy deposited is difficult to determine,the use of counts per sec or dose rate depends on large extent on circumstances of use, on both modes the radiation are being detected, in the former the activity is displayed while in the later, conversion is made to indicate the energy deposition rate,

For wide spread contamination by a radioactive material the energy rich in the GM tube will be small as the inverse square law and transient absorption remove all of the fraction of the instant particles however radiation from contamination can be measurable as the increase in the background radiation level which can easily be expressed in the increase in the no of counts per sec, as a practical radiation detection device,GM tube is not considered a natural choice for measuring the radiation than pulse device such as linac, the reason is the dead time is much longer than the pulse width duration, the detector will only pick up a single event rather than a bunch of electrons or photons and the tube will count the pulses not the radiation leading to an underestimation of dose,if that time is significantly longer than bunch frequency, the detector will count only a fraction of bunches,leading to further underreading,if the operating characteristic of GM tube and linac are known, these effects can be compensated for so the GM tube could be used, this will mean however,different methods have been used to measure the different calibration methods to measure the data,

Reference:
https://www.youtube.com/watch?v=bcjMOr-qiwA
https://www.youtube.com/watch?v=1qRjSLqM4zg

Sunday, June 29, 2014

Gadolinium : An MRI Contrast Agent

Gadolinium: An MR Contrast Agent


MRI is based on the response of proton spin in the presence of an external magnetic field when triggered with a radio frequency (RF) pulse. Under the influence of an external magnetic field, protons align in one direction. On application of the RF pulse, aligned protons are perturbed and subsequently relax to their original state. There are two independent relaxation processes: longitudinal (T1) and transverse (T2) relaxation, which are typically used to generate the MR images.1
In order for an excited spin system to return to its equilibrium magnetization, energy must be transferred from the spin system to the lattice (surrounding). The return to equilibrium is described by the spin-lattice relaxation time (T1). When T1 weighted sequences are used, the magnitude of the MR signal increases with decreasing T1 relaxation times. Further, the contrast between two tissues will of course also increase with increasing difference in T1 relaxation times between the two tissues. We know MRI creates images capable of differentiating among different tissues based on their T1 and T2 properties. However, the inherent difference in T1 relaxation time between biological tissues, or between normal and pathologic tissue is not always large enough to obtain a detectable contrast in the MR image. Sufficient contrast is of particular importance in differentiating pathological tissue from normal surrounding tissue. Exogenous MR contrast agents were therefore developed shortly after the first commercial MR systems became available in the early 1980’s. Today, MR contrast agents are typically in a significant proportion of MR examinations; with the highest usage in CNS applications (tumor diagnosis). MR contrast agents are widely used in MR angiography (MRA), they are injected into the bloodstream, and strongly T1 weighted images are acquired. Blood vessels appear much brighter than any other tissue that highlights the vessels.3
All biological systems are composed of various molecules and organisms which have different proton concentrations and different T1 relaxation times. The presence of paramagnetic ions (e.g., Gd+3 and Mn+2) near the tissue enhances its relaxation and shortens the T1 relaxation time. Contrast agents with T1 weighted enhancing ability produce bright positive signal intensity in images and increase the conspicuousness of cells, facilitating easy tracking of cells in low signal tissues. Among, those paramagnetic ions, Gd+3 are the most effective T1 weighted contrast agent for clinical use.1


Paramagnetic contrast agents, which have unpaired electrons in the outer electron shell and thus also a magnetic momentum, are used to improve imaging. Electrons affect the protons since they have a 657 times stronger magnetic momentum than protons. As a result, both the proton density in the tissue is changed directly and the local magnetic field is changed indirectly by the interaction between the electron spin of the contrast agent and the surrounding hydrogen nuclei. Apart from the paramagnetic elements manganese and iron, the lanthanide gadolinium, with its seven unpaired electrons in the outer electron shell, interact with protons in nearby water molecules to dramatically shorten the T1 relaxation time and is one of the metals most commonly used in MRI contrast agents. The appearance of tissue in which the contrast agent penetrates appears brighter on T1 weighted imaging relative to non-contrast enhanced tissues. Because of its intrinsic toxicity, however, gadolinium cannot be used in the free ionic (Gd+3), but only in the form of its water soluble chelate complexes. In particular, the derivatives of diethylenetriamine pentacetic acid (DTPA) have proved useful as MRI contrast enhancing agents.4
MR contrast agents act by selectively reducing T1 (and T2) relaxation times of tissue water through spin-interaction between electron spins of the metal containing contrast agent and water protons in tissue. However, here, we are only discussing about Gadolinium based contrast agents. In the presence of the contrast agent, the observed relaxation rate (R1=1/T1) can be split up in an intrinsic tissue contribution and a contribution from the contrast agent, according to
R1obs = R1tissue + R1ca,
Where R1tissue is the intrinsic relaxation of the tissue without the contrast agent and R1ca is a paramagnetic contribution of the contrast agent. The contribution of the contrast agent can be written as
R1ca = r1. (CA),
In which r1 is the relaxivity (in mM-1s-1) and (CA) the concentration of the contrast agent. Using R1 =1/T1, this leads to the well-known equation,
,
which shows that the shortening of the relaxation rate R1 is linear with contrast agent concentration and that contrast in the MR images can be enhanced either by using a contrast agent with a high relaxivity r1 and/or by increasing the local contrast agent concentration. It should be noted that the relaxivity apart from being a contrast agent specific parameter, also depends on the solvent and distribution, which could vary considerably in vivo, e.g. when the contrast agent is confined to the blood pool or compartmentalized in the cytoplasm of cells. This means that the contrast agent may not affect all water protons in the tissue equally. Linearity of R1 with concentration can therefore not be guaranteed under all circumstances.2
The paramagnetic contribution from the contrast agent is generally understood to originate from relaxation in two pools of water coordinated either directly with the Gd+3, called the inner sphere, or located in the second coordination sphere and the bulk, referred to as the outer sphere. The detailed interactions between the ion and the water can be understood in terms of the Solomon-Bloembergen-Morgen (SBM) theory.2
At higher concentrations, signal saturation occur meaning that a further reduction in T1 does not result in a further increase in signal intensity since the longitudinal magnetization is fully recovered. Further, when the concentration becomes very high (depending on TE) the signal will start to fall with further increase in concentration since the T2 effects of the contrast agent will start to dominate the signal behavior.5
Note that the contrast agent does not leak out from the intravascular space in normal brain tissue due to the presence of a blood brain barrier (BBB) which prevents even small molecular weight molecules like Gd chelates to enter the interstitial. Since the intravascular volume in the brain is small (<5%), little enhancement is thus seen in healthy brain tissue. In brain tumors however, the BBB can often be disrupted due to various pathological processes, resulting in a selective accumulation in the extravascular space in the tumor. The fact that many pathological processes alter the permeability of the BBB, resulting in selective accumulation of MR contrast agents is, in fact, the main reason why these agents are so useful for CNS imaging since the absence/presence of CA leakage as well as the pattern of contrast enhancement can give important indications as to the type of pathology present. Therefore, MR contrast agents not only increase the sensitivity (the ability to detect) but also the specificity (the ability to differentiate) of the diagnostic procedure.5
In most organs it passes from the vasculature into the interstitial space relatively quickly. After the initial redistribution into the extracellular fluid space with a half-life of about 11 min, Gd is gradually excreted via kidneys with a biological half-life of approximately 90 min, so in most patients it is not detectable in tissues after about 6 h although it may linger in the urine and bladder for a day. At low concentrations such as those used in normal clinical practice the major effect is the T1 shortening, and tissues which take up the agent have enhanced signal intensity on T1WI. Most clinical sites use a standard dose of 10 or 15 ml for adult patients, who approximates to 0.1mmol Gd per kg body wt. Double and even triple dose injections are routinely used for MRA and perfusion imaging and have been shown to improve the conspicuity of lesions in multiple sclerosis and metastatic disease. At concentrations higher than about 1mmol Gd Kg-1, ten times the standard dose, the effect on T2 begins to dominate and a loss of signal occurs.6
Fig: Signal Intensity vs concentration of Gd, calculated using T1W SEQ (TR=400ms, TE=15ms) and a tissue with T1=800ms and T2=75ms
 
Magnetic resonance is one of the leading diagnostic imaging modalities, since it excels in depicting tissues with high spatial resolution and has superior soft tissue contrast. Nevertheless, MRI can considerably gain from the use of contrast agents. Contrast enhanced MR angiography is now routinely used in the non-invasive evaluation of vascular diseases. Dynamic contrast enhanced MRI receives considerable attention in the assessment of stroke and tumor vascularity. MRI applications are becoming more and more dependent on contrast agents. Traditionally MR contrast agents are based on their ability to lower T1 and T2 of water. Nowadays, nanoparticle based contrast seems to be a powerful technology in both basic science as well as clinical settings. Chemical Exchange Saturation Transfer (CEST) agents, based on magnetization transfer methods have also been developed where contrast can be switched on and off at will, which facilitates localization and detection of contrast agents in living organism without the need for exact co-registration of pre and post contrast MR images. The sensitivity of CEST has increased with the invention of (liposome based) LIPOCEST agents. Researches are going on to study subcellular processes from bimodal imaging combining fluorescent markers, such as quantum dots, with MR contrast agents.1,2,5


Reference:
1.      Zhu et al, Nanoparticle-based systems for T1-weighted Magnetic Resonance Imaging Contrast Agents, Int.J.Mol.Sci.2013.
2.      Strijkers et al, MRI Contrast Agents: Current Status and Future Perspectives, Anti-Cancer Agents in Medicinal Chemistry, 2007.
3.      Image Contrast, International Center for Postgraduate Medical Education, 2009.
4.      Peter et al, Gadolinium based contrast agents, Metrohm International Headquaters, Herisau, Switzerland.
5.      MR Contrast Agents, FYS-KJM 4740 – The Physics of MRI.

6.      McRobbie et al, MRI from picture to proton, Cambridge University Press, Second Edition, 2006.